Investments
Algebra
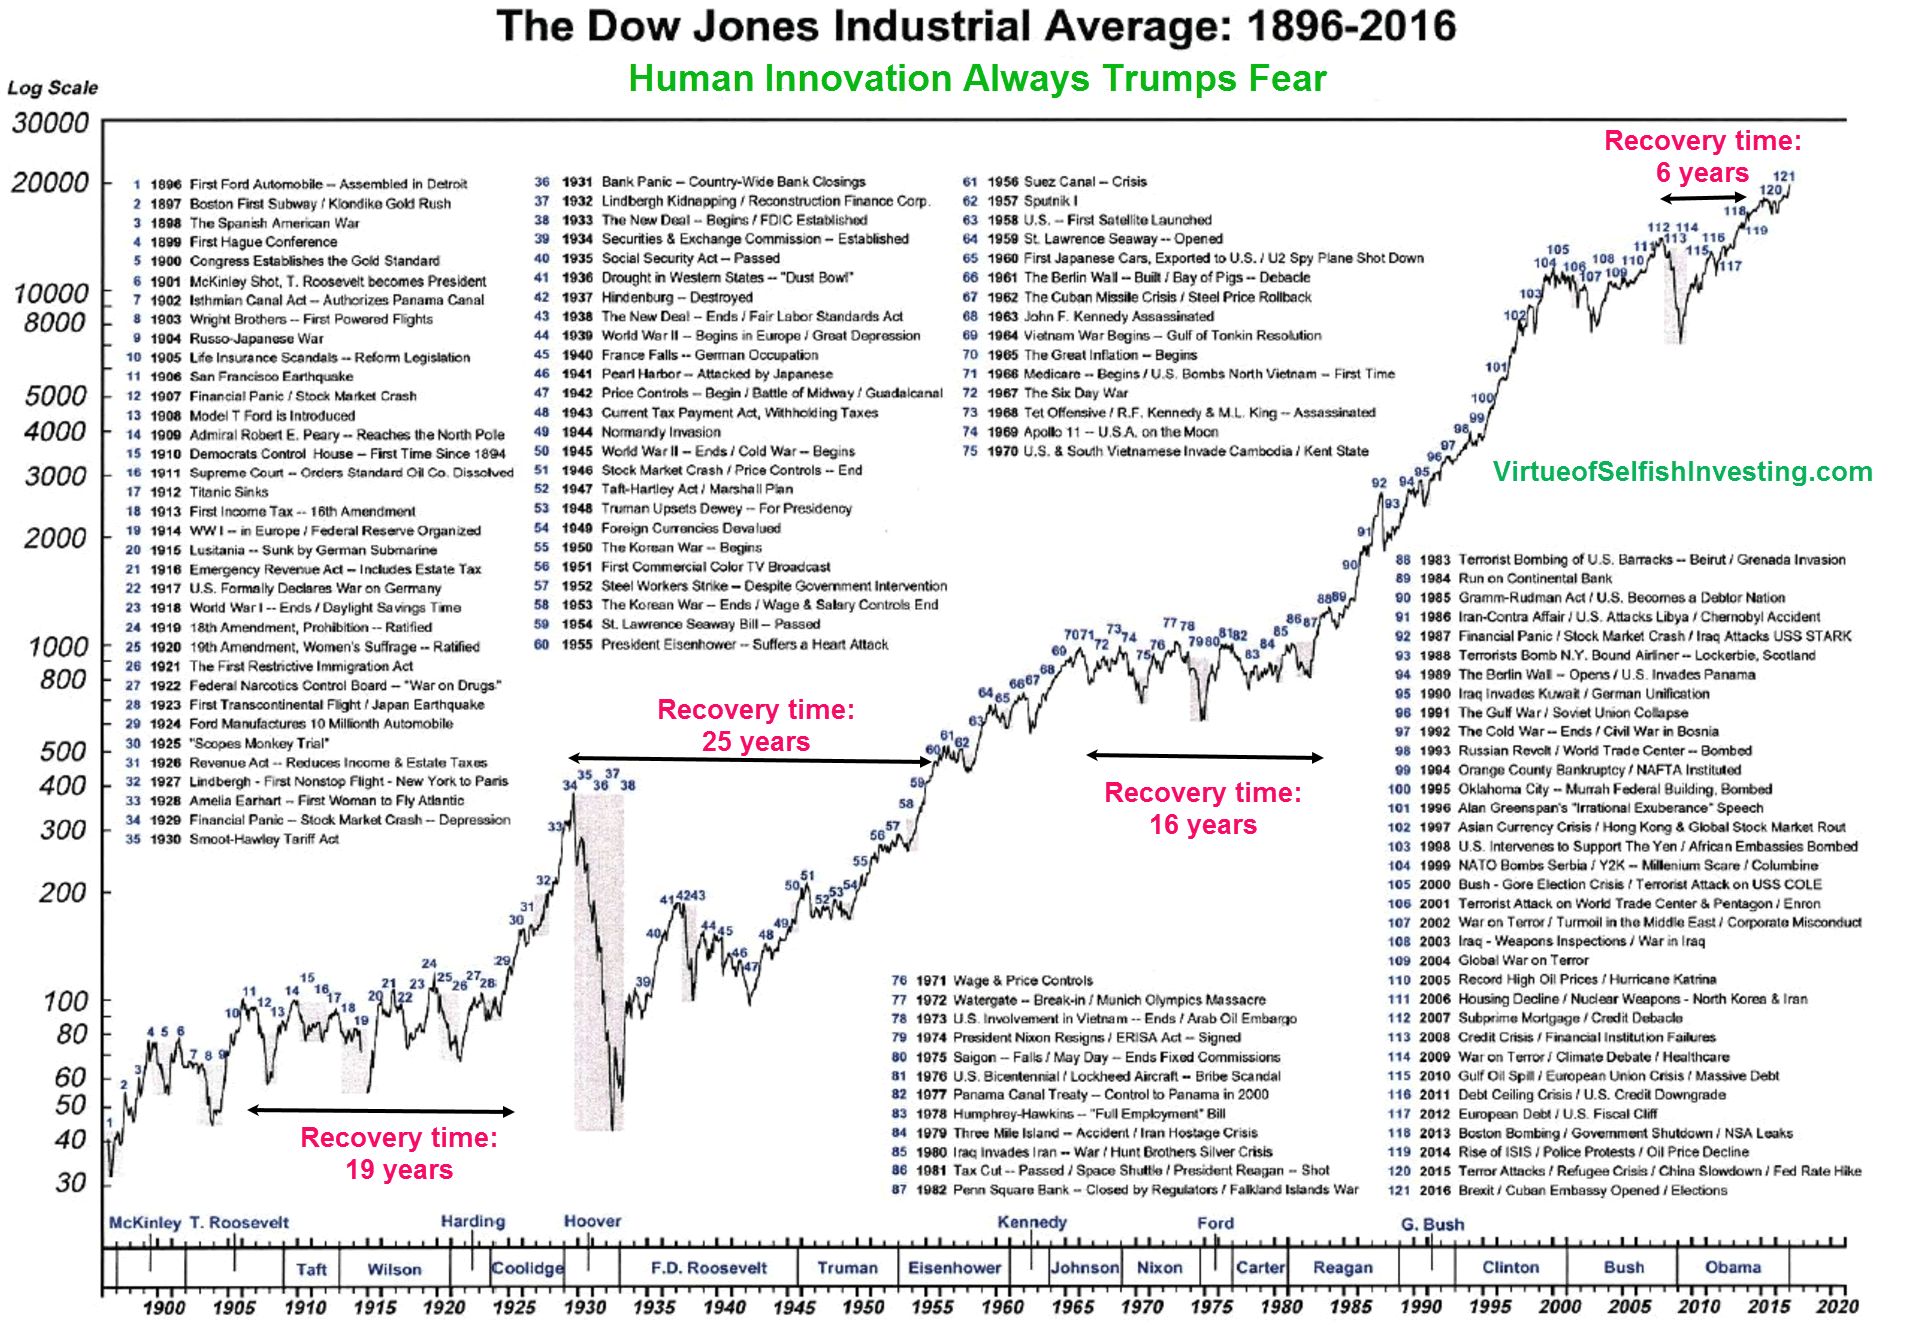
A look at market growth over the past 100 or so years.
Where this idea comes from
Start here — this is the source that inspired this exploration.
Introduction
Stock market indices such as the S&P 500 have data going back roughly a century, and the index has grown overall across that period even though individual years swing wildly. This exploration models that century of growth with compound interest, checks how well one steady rate holds up across booms and crashes, and asks what a model like that is allowed to say about the next 30 years.
Guiding Questions
- Pick a stock index with 100 years of data. What average yearly growth rate fits the data?
- Model the growth with compound interest. How well does one fixed rate describe the century?
- How do crashes and booms show up as deviations from your model? Try fitting different periods separately.
- If the pattern continued, what would an investment today be worth in 30 years — and why should you doubt that number?