Measuring inequality: what is the Gini coefficient?
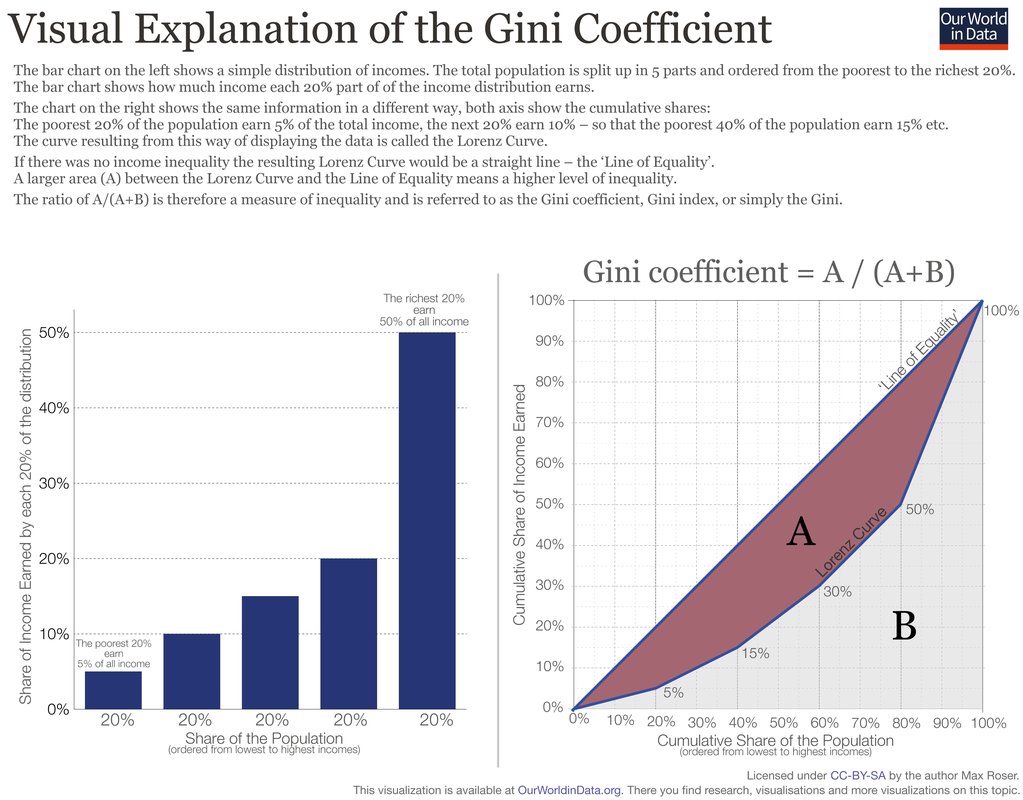
The Gini coefficient is a standard way of measuring inequality. This explores what it actually measures, and computes it directly from the Lorenz curve using areas.
Where this idea comes from
Start here — this is the source that inspired this exploration.
Introduction
The Gini coefficient measures inequality in any distribution, most often income or wealth. Named after the Italian statistician Corrado Gini, it runs from 0 (perfect equality, everyone has the same income) to 1 (perfect inequality, one person has everything and everyone else has nothing); multiplied by 100 it is sometimes called the Gini index. Behind the single number is a curve: plot the cumulative share of income against the cumulative share of the population (the Lorenz curve), and the Gini coefficient equals twice the area between that curve and the line of perfect equality. This links directly to Economics, where the Gini coefficient is a standard measure of income distribution within a country. Computing the area under the Lorenz curve exactly uses AA-level integration (AA SL areas between curves); AI students can use the trapezoidal rule or exact triangle and trapezium geometry on piecewise-linear data instead.
Guiding Questions
- Take a small made-up population and share income in different ways. How unequal does each feel?
- Draw the Lorenz curve for your examples and compute the Gini coefficient with areas (integration or geometry).
- Find real income data for two countries and compare their Gini coefficients.
- What changes the Gini — taxes, benefits? Model one intervention and measure its effect.