Sinusoidal Functions and Temperature
Functions & Equations
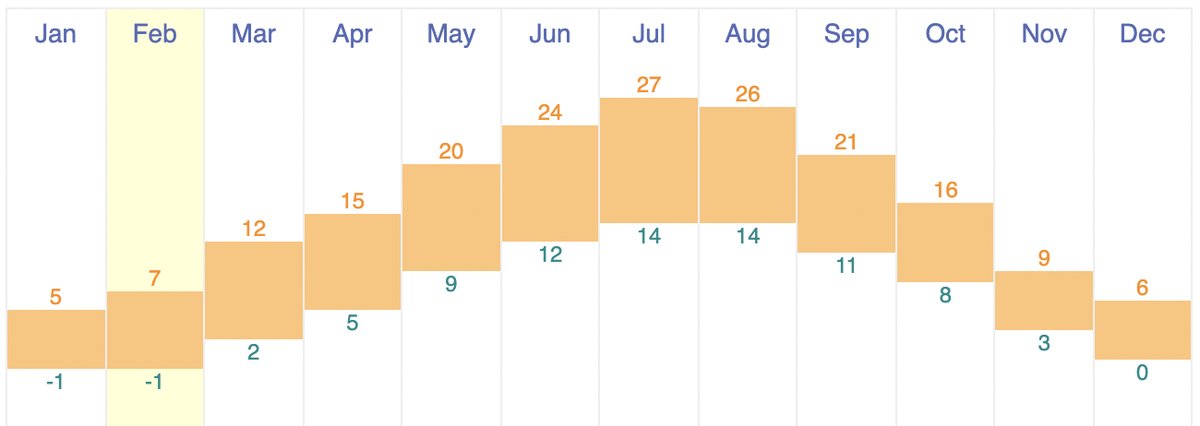
Look beyond the seasonal differences.
Introduction
Collect a year of daily temperature data for two cities and fit a sinusoidal model to each. Compare the methods you could use to fit the curve — by eye, by regression, or by reading key values straight off the data. As an extension: if a location's average temperature is rising by 0.5°C a year, what happens to your model, and what would the graph look like in fifty years?
Guiding Questions
- Plot daily temperatures for a year. Why is a sinusoidal model the right starting shape?
- Fit the model and interpret each parameter: midline, amplitude, period, shift.
- Where does the model fail — heatwaves, cold snaps? Look at the residuals.
- Compare two locations: how do their fitted parameters differ, and what explains the difference beyond the seasonal swing?