The Freddo Index
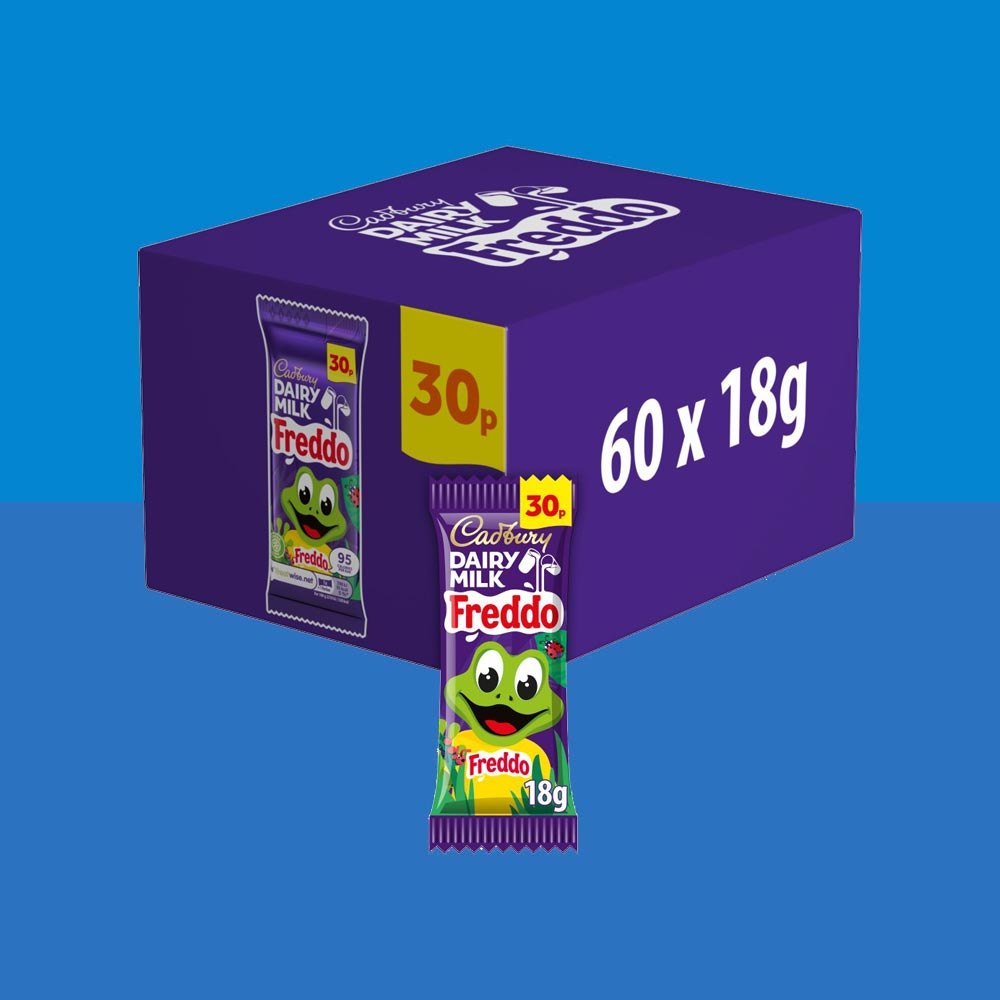
In 2000 a Freddo cost 10p. Track what it has cost since, find the growth rule hiding in the prices, and test whether 'kid inflation' runs hotter than the official rate.
Where this idea comes from
Start here — these are the sources that inspired this exploration.
Introduction
Britain half-jokes that the Freddo is the true measure of inflation — the little chocolate frog has multiplied in price since 2000, and people feel it more than any official statistic. That makes it a perfect dataset: the year-by-year prices are documented, and the pattern hiding in them is yours to find. Does the price grow by a fixed amount each year, or by a fixed percentage? The two look similar for a while and then very much don't. Build your own index from things you actually buy, compare it with the official inflation rate, and settle the argument with mathematics.
Guiding Questions
- Collect the Freddo's price for as many years as you can. Plot it. Between consecutive prices, look at both the difference and the ratio — which one stays steadier?
- Use what you found to write a rule for the price in any year, and test it: what does your rule say a Freddo should cost today, and in 2040?
- Compare your Freddo growth rate with official UK inflation over the same period. Is the frog really outpacing everything else, or does it just feel that way?
- Build your own index: pick a basket of five things you actually buy, find historical prices, and compute your personal inflation rate. Who is inflation hitting harder — you or the official 'average' person?
- Prices sometimes jump and sometimes sit still for years. Decide what real-world events your smooth rule ignores, pick one, and investigate how much it matters.