The Logistic Curve
Functions & Equations
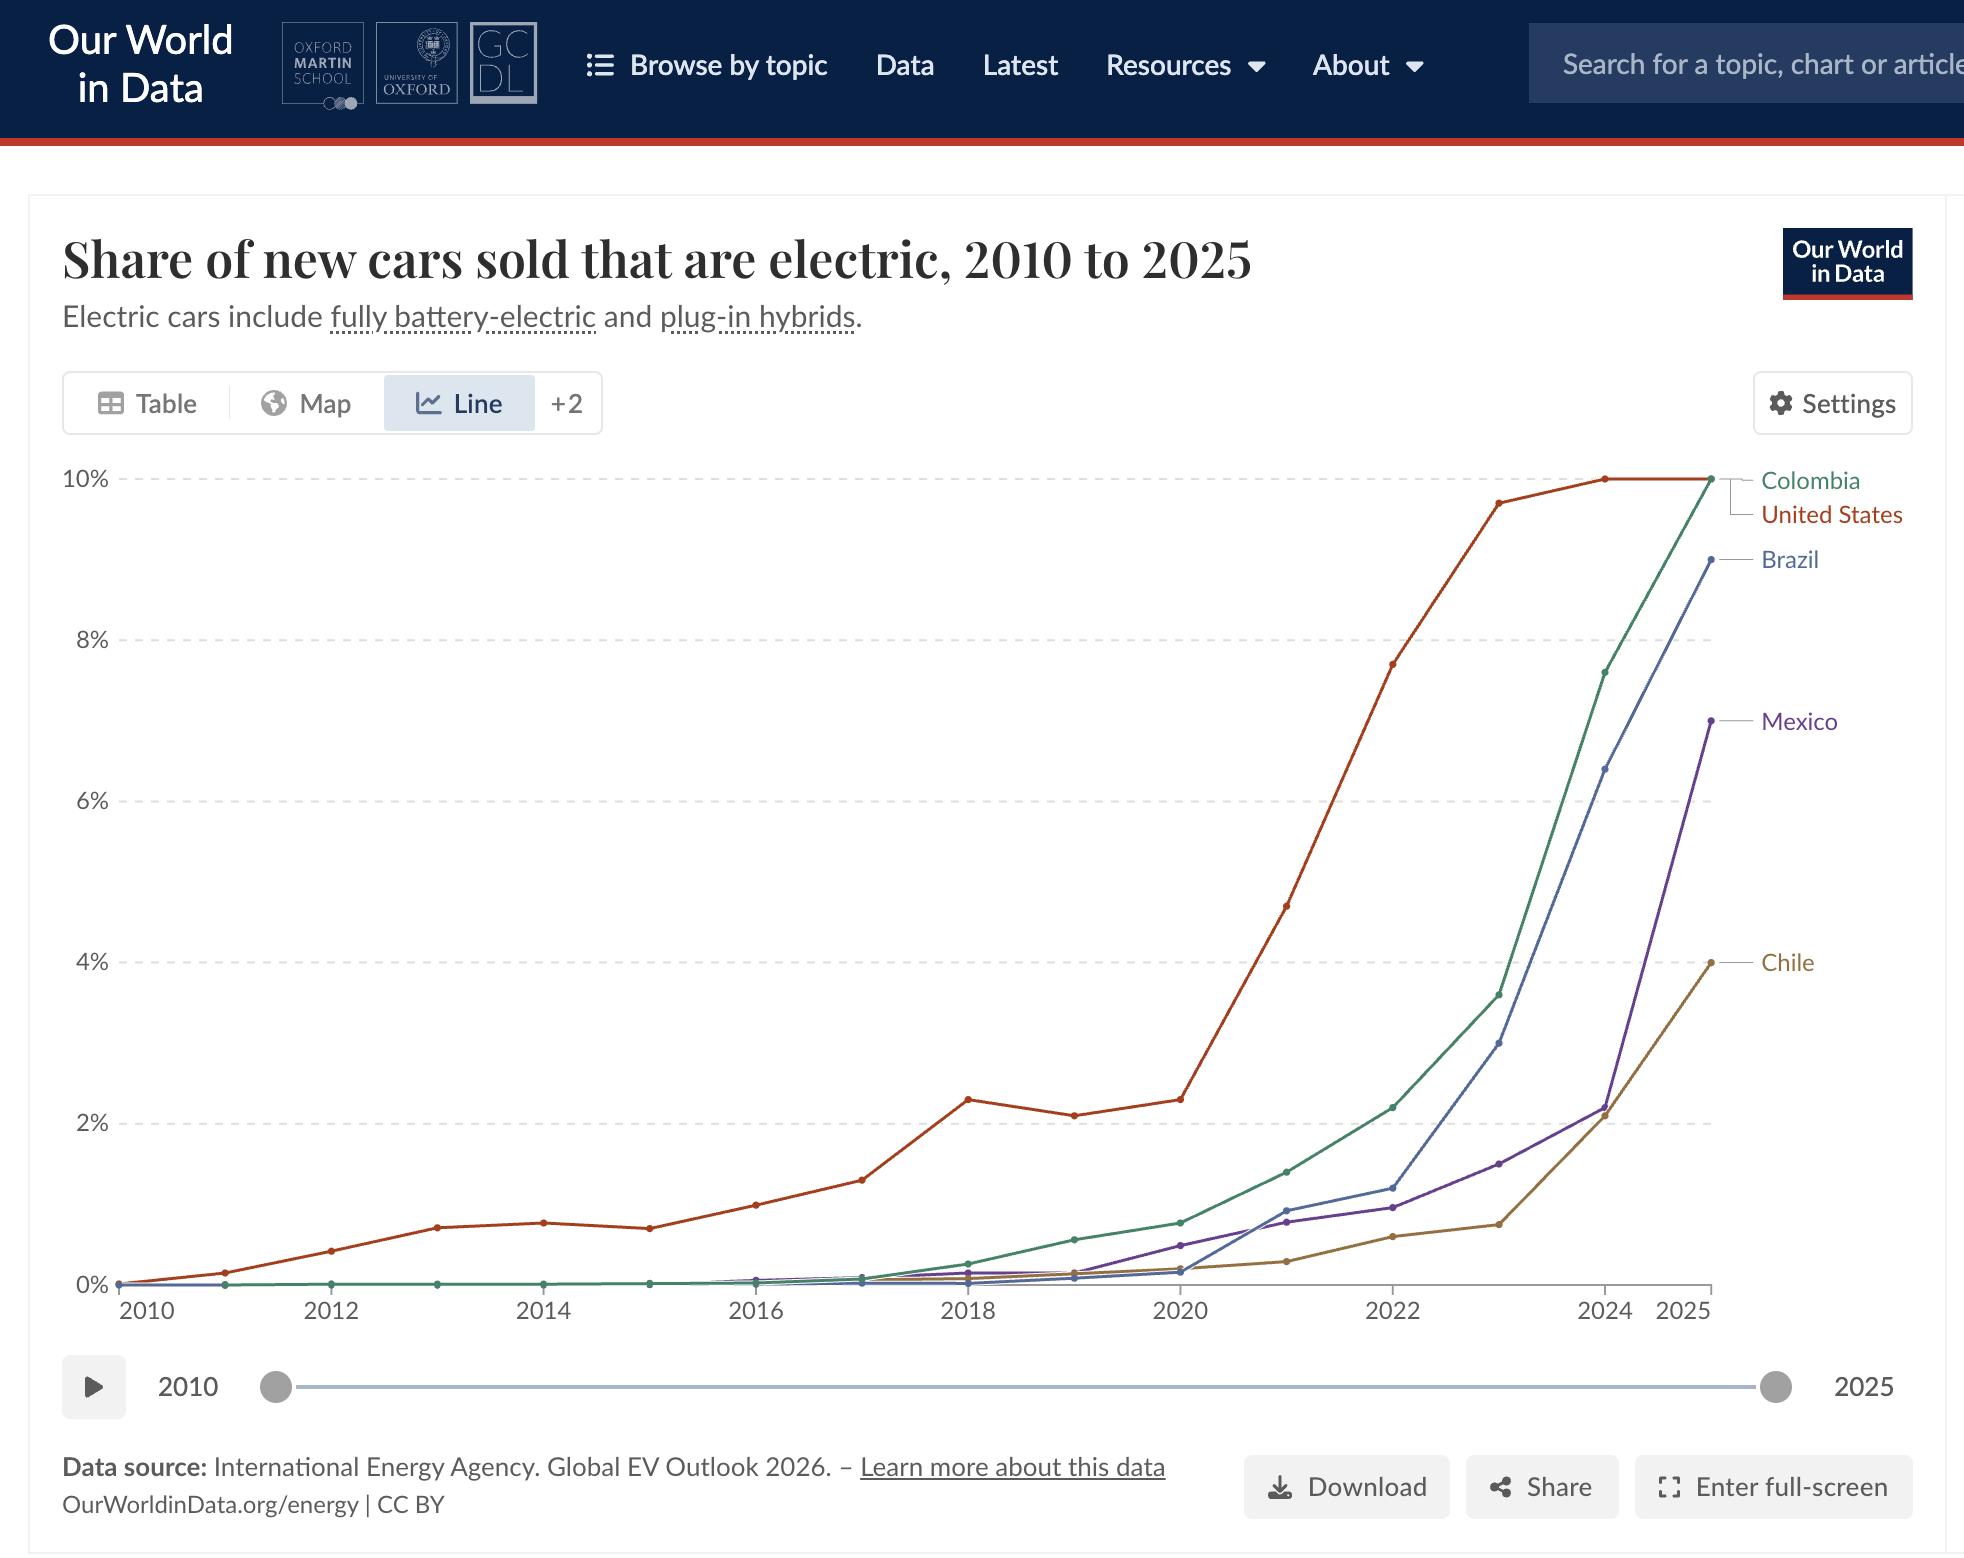
New car sales that are electric look flat for years, then rocket upward, then start to level off — a shape called a logistic curve. Comparing countries side by side shows the same shape appearing at completely different times.
Where this idea comes from
Start here — this is the source that inspired this exploration.
Introduction
Fitting this curve with sliders isn't enough on its own. Show you understand why growth slows by identifying the specific limiting factor in your chosen context — a fixed number of people who could plausibly be infected, a market that saturates, a resource that runs out — and explain the mechanism in terms a reader can follow, not just adjust parameters until the line matches.
Guiding Questions
- Look at the US, Colombia, Brazil, Mexico, and Chile's EV sales-share curves. Which countries are still in the "takeoff" phase, and which might be nearing their ceiling?
- Fit a logistic curve to one country's data. What do the carrying capacity and growth-rate parameters mean in this context?
- Where is the point of inflection for your chosen country, and what happened around that year?
- Pick a different real growth story — smartphone adoption, a social media platform's user count, a disease's case count — and test whether it follows the same S-shape.