Is Anything Actually Normal?
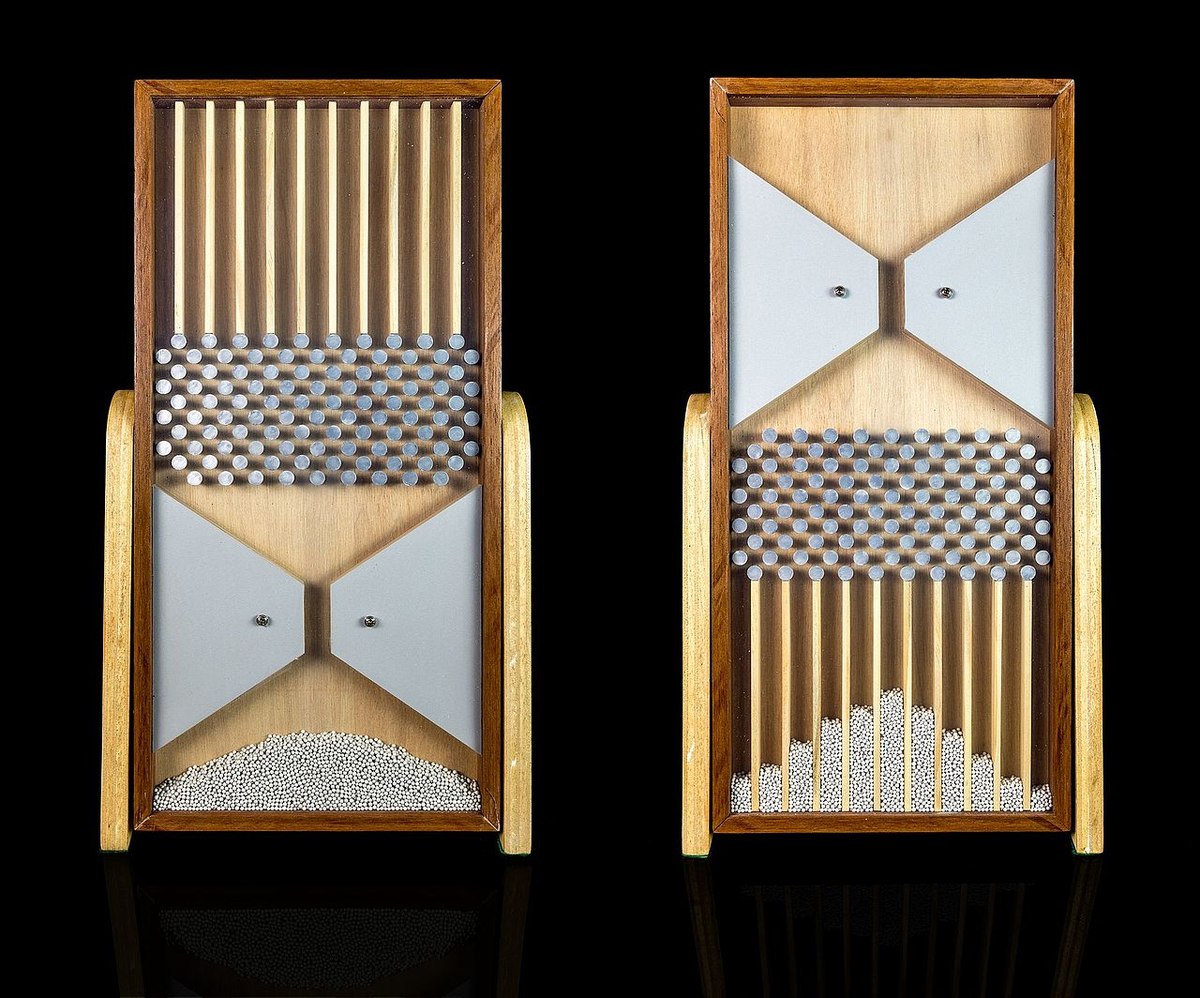
The bell curve appears throughout statistics textbooks. This exploration tests it against fifty real measurements you collect yourself, and looks for where the normal distribution fails to fit.
Where this idea comes from
Start here — these are the sources that inspired this exploration.
Introduction
Heights, reaction times, and the contents of a '100g' crisp packet are often assumed to follow the bell curve. Collect enough real measurements and you can test that claim directly: a normal distribution makes exact predictions about how many readings should fall within one and two standard deviations of the mean, so your data can confirm it or contradict it. Some everyday quantities are close to normal; others are not, such as reaction times, which have a hard floor and a long tail toward slow responses. Finding where the bell curve fails, and explaining why, is the point of this exploration. Use your own class or a public dataset to generate the numbers; the mathematics is in the distribution's shape, its predictions, and its limits.
Guiding Questions
- Choose something you can measure at least fifty times — reaction times on an online test, heights of one age group, masses of identical-label snack packets — and collect the data carefully.
- Draw the histogram. Before doing any calculations, does the shape look roughly bell-shaped? Where does it bulge, and is it symmetric?
- Compute the mean and standard deviation, then count how many of your readings fall within one and two standard deviations. What does the normal distribution predict those counts should be, and how close is your data?
- Find a quantity where the bell curve fails and diagnose why: what about how the data is produced breaks the symmetry?
- Packets stamped '100g' rely on rules about average contents. Given the spread you measured, where must the factory set its mean so almost no packet is underweight, and what does that decision cost them?