Oxford's 33.7°C: How Unusual Is a Record-Breaking Day?
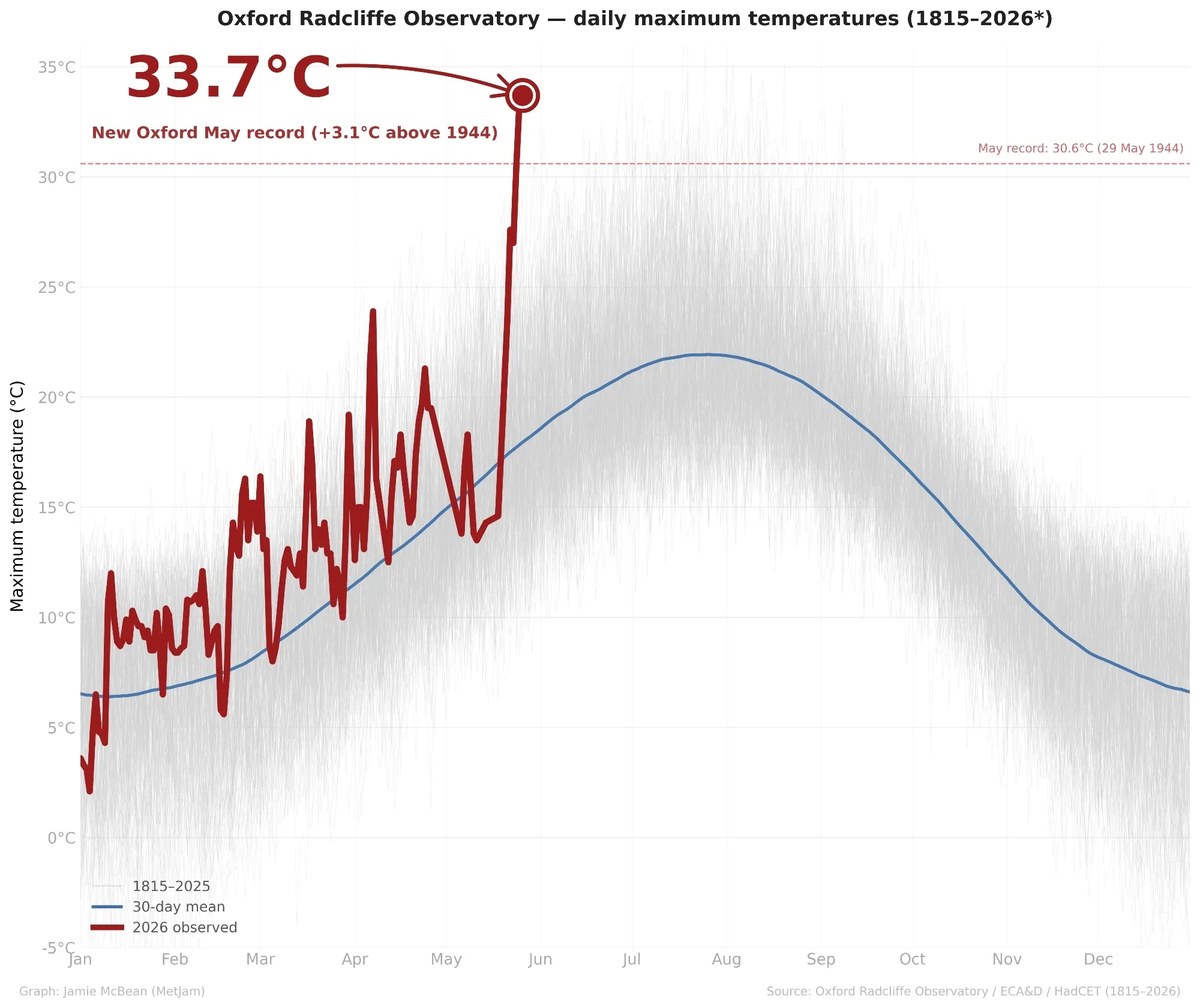
In May 2026 Oxford hit 33.7°C, beating a record that had stood since 1944 by 3.1°C. Statisticians called it more anomalous than the famous Lytton heatwave of 2021 — even though Lytton reached 49.6°C. How can that be? Standard deviations tell the story.
Where this idea comes from
Start here — these are the sources that inspired this exploration.
Introduction
The Radcliffe Observatory in Oxford has measured daily temperatures since 1815, which makes it one of the best places in the world to ask: how unusual is one hot day? The May 2026 reading of 33.7°C didn't just edge past the old record — it cleared it by 3.1°C. To compare extremes between different places, meteorologists convert each reading into standard deviations from that location's own average (after removing the warming trend). On that measure, Oxford's day was a bigger statistical outlier than Lytton, British Columbia in June 2021, where Canada's all-time record was smashed. This exploration uses real data, z-scores, the normal distribution and trend-removal — statistics with something real at stake.
Guiding Questions
- Find daily maximum temperatures for May in Oxford (or your own town) over several decades. What are the mean and standard deviation, and what does the distribution look like?
- Calculate the z-score of 33.7°C against a 1991–2020 May baseline. If the data were normal, how often would you expect a day like this?
- Why do analysts remove the warming trend before computing the anomaly? Compare the z-score with and without detrending — how much difference does it make?
- Lytton reached 49.6°C yet was called less anomalous than Oxford's 33.7°C. Explain how that is possible, and check it using the spread of summer temperatures in both places.
- In a stable climate, the chance the n-th year sets a new record is 1/n. How often should records fall by chance alone — and how does that compare with what stations are reporting now?