Blue Seven: Are Humans Bad at Being Random?
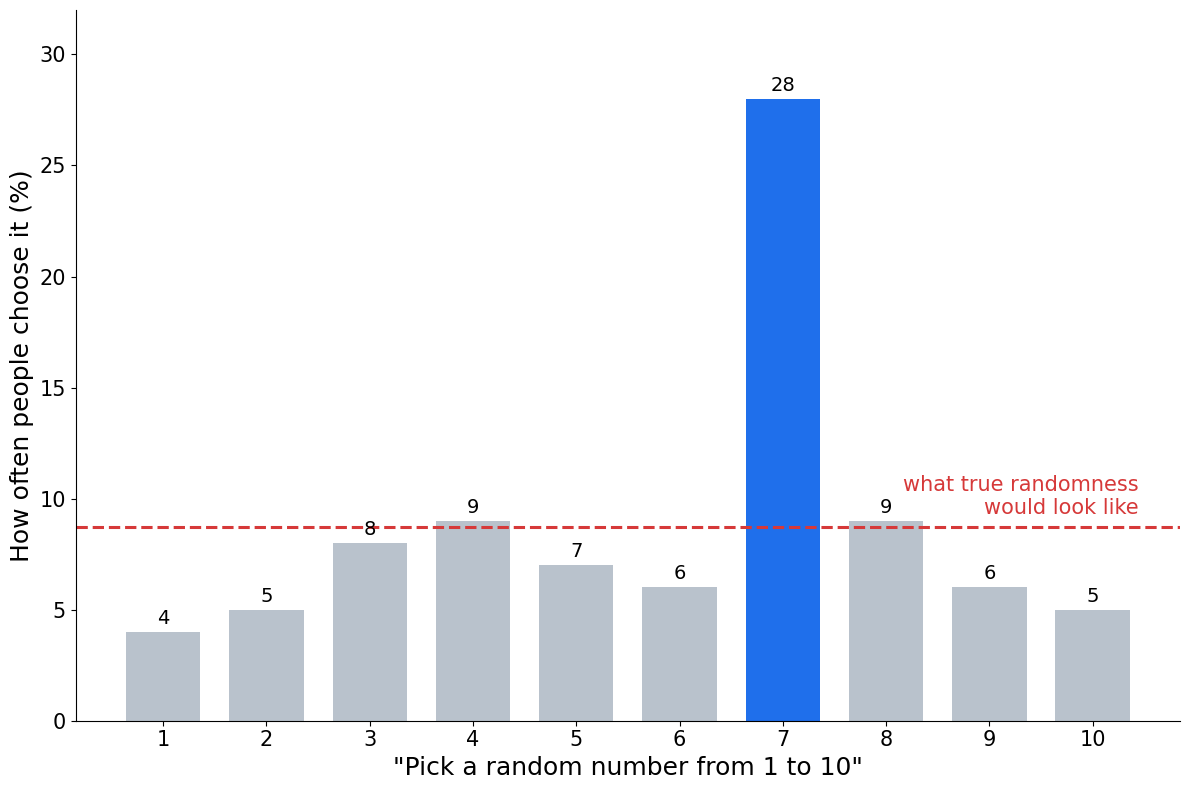
Ask people for a random colour and a random number, and the answers pile up on blue and 7 — and between 1 and 100, on 37. Design an experiment to measure how non-random our choices really are.
Where this idea comes from
Start here — this is the source that inspired this exploration.
Introduction
When people are asked to name a random number from 1 to 10, the answer 7 comes up far more often than the 10% that true randomness would give — and the most popular colour choice is blue. Psychologists call this the blue-seven phenomenon, and the same bias makes 37 and 73 strangely popular picks between 1 and 100. This is a collectable data set: survey people at school, compare your results with a uniform distribution, and test whether the effect is real in your sample.
Guiding Questions
- Survey a good sample of people: ask for a random number from 1 to 10 and a random colour. What would true randomness look like, and what does your data show?
- Use a chi-squared test to decide whether your number choices could plausibly have come from people choosing uniformly at random.
- Extend to 1-100: do 37 and 73 stand out in your data the way the video claims? How large a sample do you need before you could tell?
- Does the effect depend on something — age group, answering quickly versus slowly, maths students versus others? Design a fair comparison and test one factor.