Sorting Speeds Into Bins
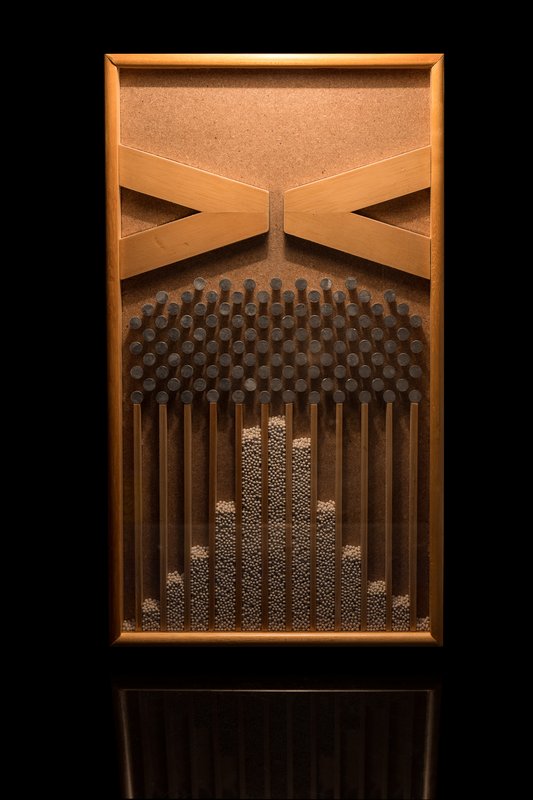
Four hundred balls bounce around inside a spinning drum, then shoot one at a time through a tiny hole into bins below. Watch long enough and the bins build a shape on their own — but it is not quite the bell curve you would expect, and the reason why is one of the most famous results in physics.
Where this idea comes from
Start here — these are the sources that inspired this exploration.
Introduction
Every ball falls the same height, so every ball takes the same time to reach the bins — the bin a ball lands in is a direct, linear readout of its launch speed. Run enough balls through and the bins build a histogram of speeds. It is tempting to assume that histogram should look Normal. Kinetic theory of gases predicts something different: because speed is the magnitude of a 3D velocity vector whose three components are each Normally distributed, the theoretical distribution of speed is Maxwell-Boltzmann — skewed, not symmetric, and always positive. This is the model that also describes how fast molecules move in the air around you, and it is a prediction to test against the bin counts, not an assumption to take on faith. Deriving the Maxwell-Boltzmann density from first principles uses continuous-distribution techniques from the AA HL syllabus; working from the AI syllabus, you can still test the prediction by simulating three Normal components and running a chi-squared goodness-of-fit test on the bin counts.
Guiding Questions
- If each ball's speed were Normally distributed, what shape histogram would you expect?
- Why isn't the distribution of a ball's speed simply Normal, even if its velocity components are?
- How would you generate Maxwell-Boltzmann-distributed samples from three independent Normal random variables?
- What happens to the histogram's shape as you increase the spread (temperature) parameter?
- How could you test, from the bin counts alone, whether the underlying speeds follow a Maxwell-Boltzmann distribution rather than a Normal one?